Pulse Counting Python Software |
Geiger Graphing Software

Program Interface description:
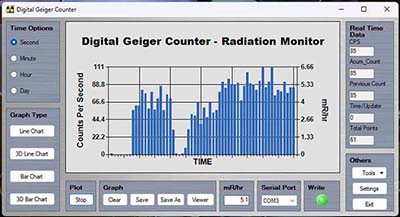
The main interface comprises of following components:
The main graph on which the values will be plotted.
Time options frame. This allows user to select different time units (Second, Minute, Hour, Day). For example, if you set the time unit to Second,
then the program will count the radiation levels perrsecond, and plot. If you set it to Minute, the program will count radiation levels per minute, and plot.
Graph type frame. This allows user to switch between different views of graph (Line Chart, 3D Line Chart, Bar Chart and 3D Bar Chart).
Plot frame. This comprises of the Start button which starts the capturing of data and plotting process.
When capturing is in progress, the same button will act as a Stop button, which stops capturing and plotting process.
Graph frame. This comprises of a Clear button which clears the graph, a Save button which saves values to the active file, a Save As button which allows to select a different file for saving, and Viewer button which launches the Viewer.
Download Free Lite Version of Images Radiation Graphing Software
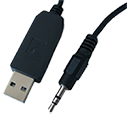
Lite version is locked in CPS mode and mR/hr. It allows you to sample the features of the full program. Lite software requires a compatible TTL Serial to USB Cable.
Software is provided as-is. Images SI Inc. is not responsible for any damages from use, misuse, compatibility, incompatibility, or installation to any particular Windows operating system.
Free Pulse Counting Python Software

Program Interface description:
The Radiation Pulse Counting Program – is the ultimate tool for accurately counting radioactive particle detection. monitoring radiation levels. Designed for seamless compatibility with a range of Geiger counters, this program is ideal for tracking background radiation, testing environmental samples, or conducting any scientific exploration where precision counts. With easy-to-use settings for custom time intervals and instant pulse readings, you can collect reliable data in real time. Whether you’re an educator, researcher, or hobbyist, this program offers a powerful and straightforward solution for your radiation measurement needs, giving you detailed insights and complete control over every experiment.
Download Free Pulse Counting Python Software
Download Free Pulse Counting Windows Software
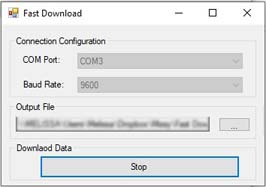
Fast Download Software For 07W-DL/07W-DL-C

Program Interface description: Program allows the ability to upload data from the GCA-07W-DL as well as the GCA-07W-DL-C to your computer in CSV, GCP or GCD Data Formats .Standalone Software does not require install just unzip and use
File Formats
CSV File May Be used in Excel or in notepad.
GCP File can be used in Execel, Notepad as Well as Images Radiation Graphing Software
GCD File format only can be utilized in Images Radiation Graphing Software
*Some Features Locked In Free Lite Version


